


在之前已经对 Halo 的
Walker主题进行部分改造,但对首页总觉得不太理想,过于单调,一上来就显示最新文章也觉得很突兀。想加点东西,却又不知道加什么好...
这个想法在我脑中盘旋许久,直到我看到了好帅哥新发布的「数据看板」插件。插件中那个熟悉的 GitHub 风格热力图,瞬间让我想起了微博哥的「微浸」主题首页上同样惊艳的设计。
这正是我一直在寻找的元素!于是,我决定动手将这个能够直观展示文章发布频率的功能,也集成到我的 Walker 主题首页上。
因为我写这篇文章的时候插件还在审核文档也没完善,所以文中涉及的样式修改并未参考插件文档,等后续有时间了再同步一下
🛠️改造步骤
整个集成过程清晰明了,主要分为修改主题模板与微调显示样式两个步骤。
注意:如果使用插件默认样式直接将下方 HTML 代码插入展示的位置即可
<div class="xhhaocom-chartboard" data-types="articles"></div>修改主题模板文件
首先,需要编辑 Walker 主题的首页模板文件,其在服务器上的典型路径为halo/data/themes/theme-walker/templates/index.html。
使用编辑器打开该文件,在最新文章的上方区域,插入HTML代码,用于承载热力图的渲染。
  <div class="main flex flex-col px-4 lg:flex-row">
    <th:block th:replace="~{modules/sidebar}" />
    <div class="content-wrapper pt-32 lg:w-3/4 lg:p-8" :class="{ 'is-second' : menuVisible }">

      // [!code highlight:4]
      <!-- 添加趋势图 -->
      <div id="xhhaocom-articles">
        <div class="xhhaocom-chartboard" data-types="articles"></div>
      </div>

      <h2 class="mb-8 inline-flex items-center gap-2 text-lg text-base-content/90">
        <i class="i-ri-article-line inline-block"></i>
        最新文章
      </h2>
      <th:block th:replace="~{modules/post-list}" />
       <div th:if="${posts.hasNext()} and ${not posts.hasPrevious()}">
        <a th:if="${posts.hasNext()}" th:href="@{${posts.nextUrl}}"
          class="animated fadeIn inline-flex items-center gap-1 border-b-2 border-b-transparent text-sm font-extrabold text-base-content/90 hover:border-base-content hover:text-base-content">
          阅读更多
          <i class="i-ri-arrow-right-line inline-block"></i>
        </a>
      </div>
样式微调
为了确保热力图的视觉风格能与 Walker 主题无缝融合,我还添加了自定义 CSS 代码。
<th:block th:fragment="content">
// [!code highlight:93]
<style>
#xhhaocom-articles .xhhaocom-chartboard {
padding: 0px 0px 12px !important;
font-family: revert !important;
}
#xhhaocom-articles .xhhaocom-chartboard-section {
border: none !important;
background: transparent !important;
box-shadow: none !important;
}
#xhhaocom-articles .xhhaocom-chartboard-section__header {
padding: 0px 0px 14px !important;
border: none !important;
gap: revert !important;
}
#xhhaocom-articles .xhhaocom-chartboard-section__title {
color: var(--fallback-bc, oklch(var(--bc) / .8)) !important;
font-size: 1.125rem !important;
font-weight: normal !important;
line-height: 1.75rem;
}
/* 添加图标 - 趋势图表图标 */
#xhhaocom-articles .xhhaocom-chartboard-section__title::before {
content: "";
display: inline-block;
width: 18px;
height: 18px;
margin-right: 8px;
margin-top: -3px;
vertical-align: middle;
background-image: url("data:image/svg+xml,%3Csvg xmlns='http://www.w3.org/2000/svg' viewBox='0 0 24 24' fill='none' stroke='%232563eb' stroke-width='2' stroke-linecap='round' stroke-linejoin='round'%3E%3Cpolyline points='23 6 13.5 15.5 8.5 10.5 1 18'%3E%3C/polyline%3E%3Cpolyline points='17 6 23 6 23 12'%3E%3C/polyline%3E%3C/svg%3E");
background-size: contain;
background-repeat: no-repeat;
background-position: center;
}
#xhhaocom-articles .xhhaocom-chartboard-section__subtitle {
color: var(--fallback-bc, oklch(var(--bc) / .6)) !important;
font-size: .75rem !important;
line-height: 1rem;
margin-top: 0.2rem;
}
#xhhaocom-articles .xhhaocom-chartboard-section__body {
padding: 18px 0px 20px !important;
}
#xhhaocom-articles .xhhaocom-chartboard-card {
background: transparent !important;
}
#xhhaocom-articles .xhhaocom-chartboard-heatmap__day[data-level="1"] {
background: var(--fallback-p, oklch(var(--p) / .3)) !important;
}
#xhhaocom-articles .xhhaocom-chartboard-heatmap__day[data-level="2"] {
background: var(--fallback-p, oklch(var(--p) / .5)) !important;
}
#xhhaocom-articles .xhhaocom-chartboard-heatmap__day[data-level="3"] {
background: var(--fallback-p, oklch(var(--p) / .7)) !important;
}
#xhhaocom-articles .xhhaocom-chartboard-heatmap__day[data-level="4"] {
background: var(--fallback-p, oklch(var(--p) / .95)) !important;
}
#xhhaocom-articles .xhhaocom-chartboard-heatmap__legend-dot[data-level="1"] {
background: var(--fallback-p, oklch(var(--p) / .3)) !important;
}
#xhhaocom-articles .xhhaocom-chartboard-heatmap__legend-dot[data-level="2"] {
background: var(--fallback-p, oklch(var(--p) / .5)) !important;
}
#xhhaocom-articles .xhhaocom-chartboard-heatmap__legend-dot[data-level="3"] {
background: var(--fallback-p, oklch(var(--p) / .7)) !important;
}
#xhhaocom-articles .xhhaocom-chartboard-heatmap__legend-dot[data-level="4"] {
background: var(--fallback-p, oklch(var(--p) / .95)) !important;
}
@media (max-width: 768px) {
#xhhaocom-articles .xhhaocom-chartboard {
padding: 0px 0px 8px;
}
}
</style>
<div class="main flex flex-col px-4 lg:flex-row">
<th:block th:replace="~{modules/sidebar}" />
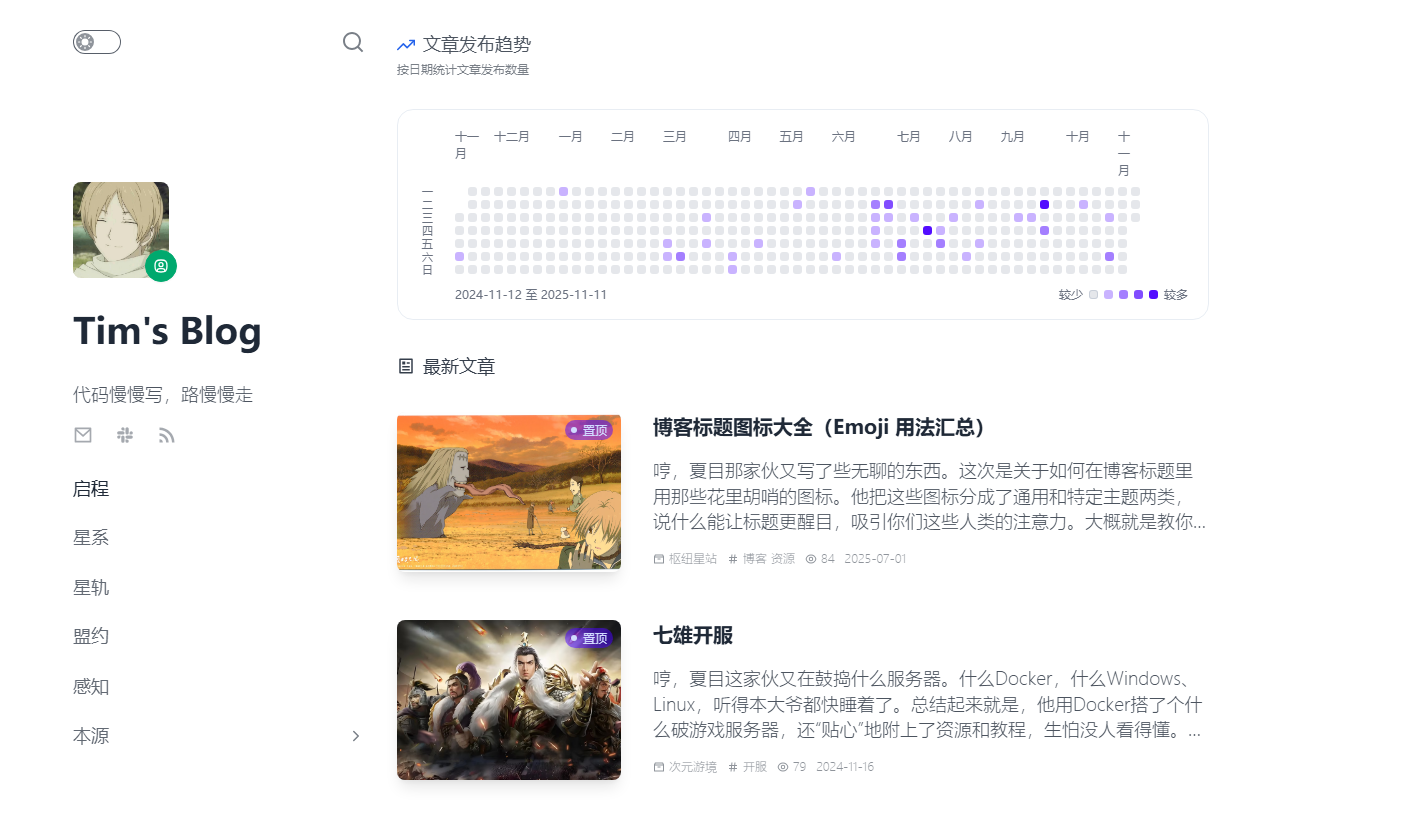
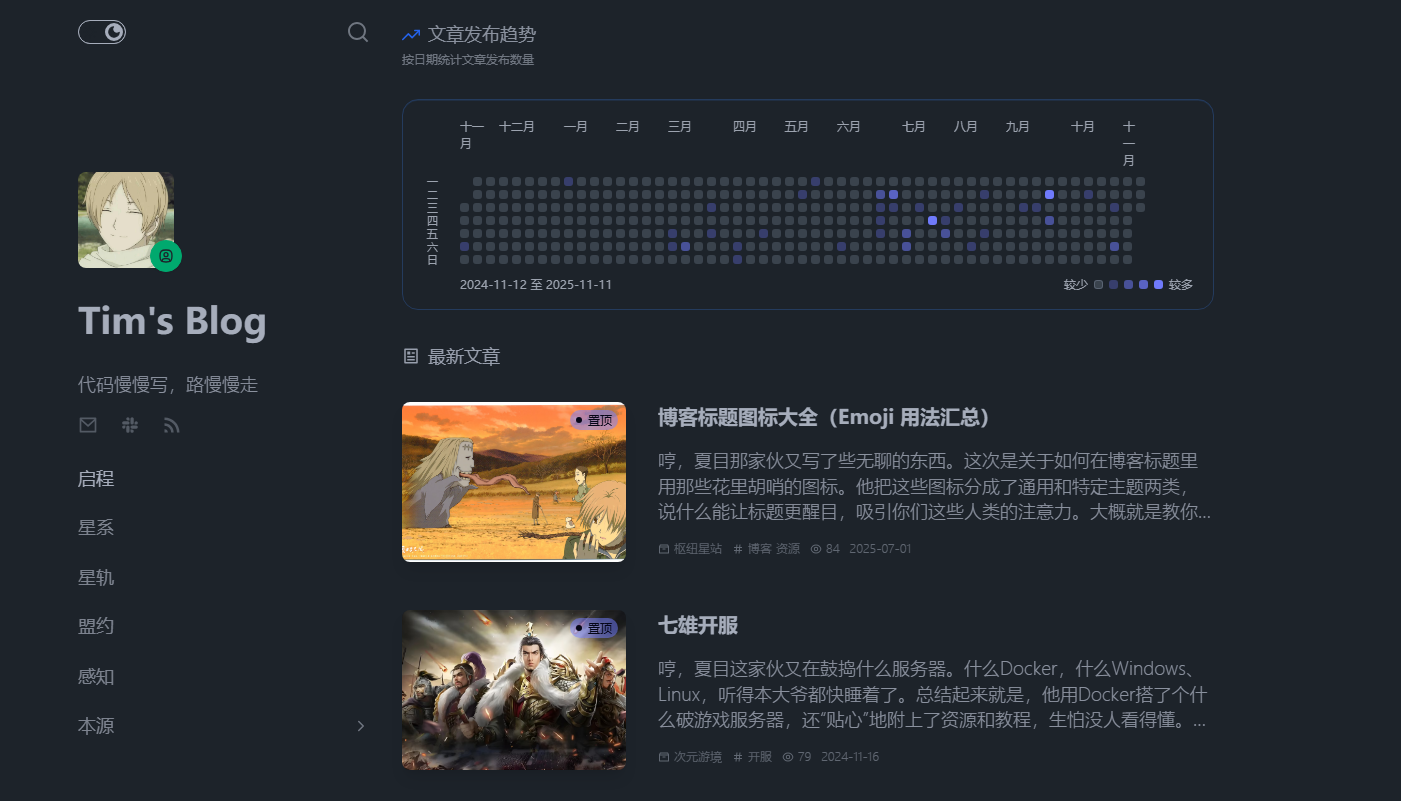
<div class="content-wrapper pt-32 lg:w-3/4 lg:p-8" :class="{ 'is-second' : menuVisible }">🎨最终效果
完成以上步骤后,博客首页的面貌焕然一新。现在,一张记录着文章发布轨迹的热力图成为了页面的视觉焦点,它不仅打破了原有的沉闷布局,也为我的博客增添了一份独特的动态数据之美。
最后,再次向「数据看板」插件的开发者好帅哥致以感谢,他的开源贡献为 Halo 社区带来了极大的便利。